Apr 21, 2020 · 4 min read
Labelled Data Creation for Tabular format Anomaly data benchmarking.
A data science note on creating labelled synthetic anomaly data so anomaly detection models can be benchmarked with classification metrics.

Synthetic generation of labelled data for benchmarking Anomaly models .
On a simpler note at the very beginning, a point can be an “ anomaly” or “not anomaly”. We use this simple idea in our further journey.
We all know, for classification problems we have so many performance metrics to benchmark our designed models. Some examples are like: False Positive rate, False Negative rate, AUC-ROC. These performance metrics are very important for trusting our model. Often data scientists uses the line,
“We can afford to classify a non-infected patient as an infected patient, but vice-versa is deadly”.
Such is the importance of these performance metrics because these are the indicators we can trust with and the same can be applied for anomaly problems also. We can
“afford to classify a non-anomaly point as anomaly point, but vice-versa is deadly.”
This is why we need to benchmark anomaly models also.
But……..to get these metric values in classification problems, we often compare our model predicted values with the actual values. For example in the case of binary classification, we often know the classes of each instances in our test data and compare them with the classes predicted by our model on the same test data. Can be better understood with below image..
Using the confusion matrix, we can derive all the performance metrics to benchmark our classification model. Now, we are going to use the same technique for benchmarking anomaly models also.
Robin: Hey batman, wait I have a doubt. For classification which is a supervised learning we have the actual values with us and so we can use the above procedure. But, are there any dataset for anomaly with anomaly & non-anomaly points already labelled?
Batman: No, there are no such datasets. We are going to create them robin.
So idea here is, we are going to create a synthetic dataset in which we will classify(label) the value as either an “anomaly” or “non-anomaly” based on the below given & very popular statistical statement. Once, we have the dataset with already labelled output, will give the dataset to our anomaly model and then compare the identified anomaly points with the actual labeling we already have. Boom → We will get our performance metrics as our problem became classification once again.
A value that falls outside of 3 standard deviations is part of the distribution, but it is an unlikely or rare event at approximately 1 in 370 samples. Three standard deviations from the mean is a common cut-off in practice for identifying outliers in a Gaussian or Gaussian-like distribution.
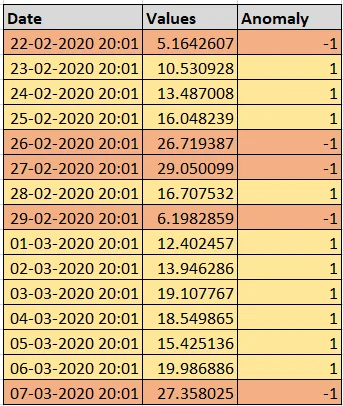
We are going to create a dataset and add some anomalies intentionally using the above rule and then label the target column as we already know which are “anomalies” or “non-anomalies”. Below is snippet of the resultant csv file created.
Here is the code part and that is quite simple..
import numpy as np
import pandas as pd
from random import shuffle
from datetime import datetime
def collection_creation(start, end, n_samples):
    collection= np.random.uniform(start, end, n_samples)
    return list(collection)
def boundaries(values):
    mean=np.mean(values)
    std_dev=np.std(values)
    a=mean+(3*std_dev)
    b=mean-(3*std_dev)
    c=mean+(9*std_dev)
    d=mean-(9*std_dev)
    return a,b,c,d
def mix_shuffle(a,b,c):
    mixture=a+b+c
    shuffle(mixture)
    return mixture
def generate_datecolumn(a,b):
    datecolumn=pd.date_range(end=datetime.today().replace(microsecond=0, second=0) , periods=len(a), freq=b).to_pydatetime()
    return list(datecolumn)
def data_generator(date, values, u_b, l_b):
    data=pd.DataFrame()
    data["Date"]=date
    data["Values"]=values
    data["Anomaly"]=np.where((data["Values"]>u_b)|(data["Values"]<l_b),-1,1)
    return data
def synthetic_data(start, end, n_sample, n_upper_cross, n_lower_cross, freq):
    collection=collection_creation(start, end, n_sample) #
    upper_boundary, lower_boundary, extreme_right, extreme_left= boundaries(collection)
    upper_crossed=collection_creation(upper_boundary, extreme_right, n_upper_cross)
    lower_crossed=collection_creation(lower_boundary, extreme_left, n_lower_cross)
    mixture_shuffle=mix_shuffle(collection, upper_crossed, lower_crossed)
    datelist= generate_datecolumn(mixture_shuffle, freq)
    final_data= data_generator(datelist, mixture_shuffle, upper_boundary, lower_boundary)

    return final_data
This function takes 6 inputs (using 6 inputs for providing more flexibility to the end user with the synthetic data).
- Start: Least value for the range of values user want to use.
- End: Highest value for the range of values user want to use.
- n_samples: How many values user want in this range.
- n_upper_cross: How many anomalies user want above “+(3*Std_dev)”.
- n_lower_cross: How many anomalies user want below “-(3*Std_dev)”.
- freq: Frequent of synthetic data user want.
E.g: If I say→ create_synthetic_data(10, 20, 50,5,5,’D’)
This means, I want a dataset in which my basic values are in the range of (10, 20) and I want 50 such values. Now, add 5-anomalies which are crossing the right side 3*standard_deviation and add 5-anomalies which are crossing the left side 3*standard_devaition. Frequency of my data should be “Daily”. The above pasted snippet is the output for the mentioned inputs.
Now, we have labelled dataset with us. Use this same data for your anomaly model and get the outputs (either an anomaly or not). Now, compare the obtained results with the labels we already have and get the performance metrics for your anomaly model.
Thank you for reading this article. This is my first technical article and any constructive advices are highly appreciable. Clap on the left side clap button, if you feel this article is useful.
Naresh Silla, Junior Data Scientist, Curl Analytics.